src.http_balancer
It is recommended to check PI Controller documentation before going through this document.
Summary
This simulation investigates that a proportional-integral (PI) controller structure can be used to balance the work load of two HTTP servers which accepts requests from a single source.
The auto-generated PT net diagram is given below.
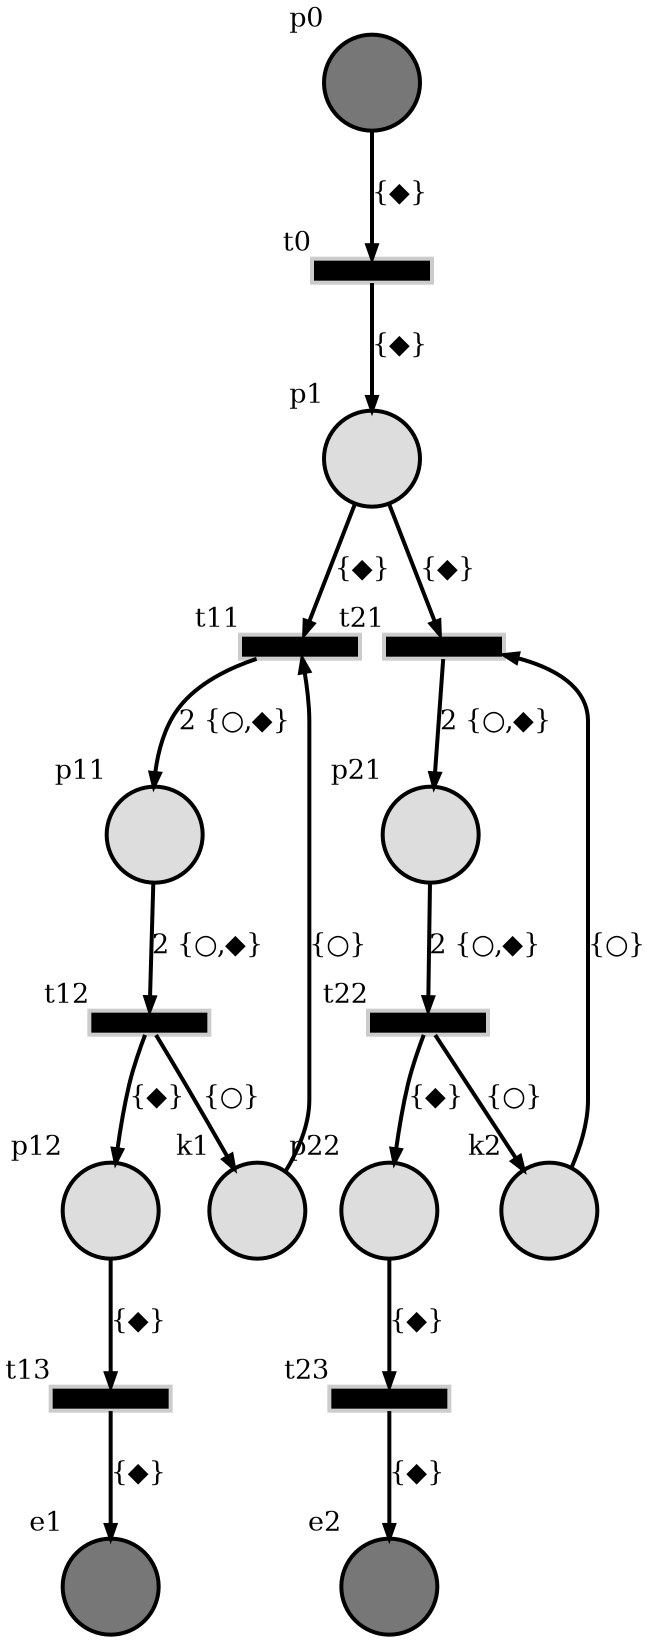
In the diagram,
\(p_0\) is producing the requests which are represented by tokens with ‘◆’ labels. The tokens are generated at a pre-determined rate.
\(e_1\) and \(e_2\) are consumers.
At \(p_1\), the graph is branching and \(p_1\) is redirecting the request to the first available branch found.
Transition \(t_{11}\) fires when \(k_1, p_1\) both have tokens. After it fires, the request at \(p_1\) is transfered to the input buffer \(p_{12}\) of consumer \(e_1\) through \(p_{11}\).
Transition \(t_{21}\) fires when \(k_2, p_1\) both have tokens. After it fires, the request at \(p_1\) is transfered to the input buffer \(p_{22}\) of consumer \(e_2\) through \(p_{21}\).
Finally, the requests are processed at consumers \(e_1\) and \(e_2\). And, each processing takes a random amount of time while the producer can generate tokens at a nearly constant rate which can be greater than average processing rate.
Control rule:
The places \(k_1\) and \(k_2\) are considered as controllers that aims to balance the work load of consumers. Because, \(t_{11}\) and \(t_{21}\) can not fire unless \(k_i\) allows. So, \(p_1\) is forced to redirect request to the enabled branch. After \(t_{i1}\) is fired, the token labeled by ‘○’ will loop back to \(k_i\) at the next step.
System description
The simulation consists of
Producer
TCP clients at consumers
HTTP servers
Conrollers
The whole implementation can be found at https://github.com/dmrokan/soyutnet-simulations/blob/main/src/http_balancer/main.py
Compared to the PI Controller simulation the only difference is the implementation of the producer and consumers.
Producer
In this case, the main asyncio loop starts a Uvicorn HTTP server.
642
643    soyutnet.run(reg, extra_routines=[canceller(), uvicorn_main()])
644    """Start simulation"""
645
A new token is generated when the HTTP server receives a request. The request data is binded to the token.
284
285    treg = net.TokenRegistry()
286    req_queue = asyncio.Queue()
287
288    def new_http_request_token(scope, receive, send, cond):
289        token = net.Token(label=L, binding=(scope, receive, send, cond))
290        treg.register(token)
291
292        return (token._label, token._id)
293
294    async def uvicorn_app(scope, receive, send):
295        if scope["type"] != "http":
296            return
297        cond = asyncio.Condition()
298        token = new_http_request_token(scope, receive, send, cond)
299        await req_queue.put(token)
300        async with cond:
301            await cond.wait()
302        """Wait until endpoint fullfills HTTP request"""
303
Then, the token is injected to the PT net. However, only the label and ID of token
travels through the net. The binded object is registered in the soyutnet.SoyutNet.TokenRegistry.
321
322    async def producer(place):
323        token = await req_queue.get()
324        return [token]
325
326    """Inject token"""
327
Consumers
Similar to the PI Controller simulation, consumers \(e_1\) and \(e_2\) receive tokens as a label and ID. Then they convert it to the actual token as given below.
391
392        t0 = time.time()
393
394        def dt():
395            return time.time() - t0
396
397        nonlocal consumer_stats
398        t0 = time.time()
399        ident = place.ident()
400        index = int(place._name[1:]) - 1
401        """Get branch index (0 or 1)"""
402        sensor = sensors[index]
403        if ident not in consumer_stats:
404            """Initialize stats at first call of the producer."""
405            consumer_stats[ident] = {"started_at": time.time(), "count": 0}
406            """Store initial time and number of requests processed to calculate requests per second."""
407            sensor.put_nowait((True, dt()))
408            """Initial push to the controllers, otherwise they will stuck at waiting the sensor."""
409
410        label = L
411        token = place.get_token(label)
412        T = time.time()
413        if not token:
414            consumer_stats[ident]["last_at"] = time.time()
415            sensor.put_nowait((False, dt()))
416            """If there is no new token in the buffer, inform the controller."""
417            return
418
419        actual_token = treg.pop_entry(*token)
420        """Get actual SoyutNet.Token object from SoyutNet.TokenRegistry"""
421        if actual_token is None:
422            consumer_stats[ident]["last_at"] = time.time()
423            sensor.put_nowait((False, dt()))
424            """If there is no actual token in the register, inform the controller."""
425            return
426
Then consumers redirect the HTTP request defined by the token to the actual HTTP servers running in children processes.
430
431        uvicorn_scope, uvicorn_receive, uvicorn_send, cond = actual_token.get_binding()
432        """Get object binded to the actual token"""
433        await http_proxy(uvicorn_scope, uvicorn_receive, uvicorn_send)
434        """Fulfill the request."""
435        async with cond:
436            cond.notify_all()
437        """Inform uvicorn_app that request is replied"""
438
Finally, the HTTP response is sent to original source by await uvicorn_send(...) lines.
HTTP servers
The simulation runs two additional instances of Uvicorn HTTP servers in children processes which echo back the body of POST requests.
 64
 65    async def read_body(receive):
 66        """
 67        Read and return the entire body from an incoming ASGI message.
 68        """
 69        body = b""
 70        more_body = True
 71
 72        while more_body:
 73            message = await receive()
 74            body += message.get("body", b"")
 75            more_body = message.get("more_body", False)
 76
 77        return body
 78
 79    async def uvicorn_app(scope, receive, send):
 80        """
 81        Echo the request body back in an HTTP response.
 82        """
 83        body = await read_body(receive)
 84        delay_amount = rand()
 85        await asyncio.sleep(delay_amount)
 86        """Imitate a time consuming process by delay."""
 87        await send(
 88            {
 89                "type": "http.response.start",
 90                "status": 200,
 91                "headers": [
 92                    (b"content-type", b"text/plain"),
 93                    (b"content-length", str(len(body)).encode()),
 94                ],
 95            }
 96        )
 97        await send(
 98            {
 99                "type": "http.response.body",
100                "body": body,
101            }
102        )
103
It imitates doing a time consuming work by sleeping.
Controllers
This simulations uses the same controller schemes in PI Controller simulation. Additionally, a new control scheme is implemented which is labeled by ‘C3’.
C3
The controller scheme C2 aims to make number of requests processed by two consumer equal by applying a PI control rule to the difference between the number of requests processed. It purposedly delays a branch if it is processing faster than the other.
‘C3’ considers the time consumed while processing requests instead of the number of requests. It tries to minimize the processing time for both consumers and also the difference between their total processing times.
447
448    ci = [0.0, 0.0]
449    """Integrator states"""
450    Kp = 1e-2 if not K_PI else K_PI[0]
451    """Propotional gain"""
452    Ki = 1e-4 if not K_PI else K_PI[1]
453    """Integrator gain"""
454    Zi = 1e-2
455    """Integrator damping"""
456    count = [0, 0]
457    """Total number of times the transitions t13 and t23 fire."""
458    total_delay = [0.0, 0.0]
459    """Total amount of time spent by consumers for completing HTTP requests."""
460
461    async def controller(place):
462        nonlocal ci
463        if not CONTROLLER_ENABLED:
464            """This happens when controller is chosen 'none'"""
465            return True
466        index = int(place._name[1:]) - 1
467        """Get branch index."""
468        sensor = sensors[index]
469        value: tuple[bool, float] = await sensor.get()
470        """Receive a notification from the consumer."""
471        if CONTROLLER_TYPE == "C2":
472            """This happens when controller is chosen 'C2'"""
473            count[index] += 1
474            err = count[index] - count[1 - index]
475            """Calculate the difference between branches"""
476            sleep_amount = Kp * err + ci[index]
477            ci[index] = (1.0 - Zi) * ci[index] + Ki * err
478            """PI controller"""
479            if abs(sleep_amount) > 1e4:
480                """This should never happen."""
481                print("!!!", sleep_amount, "!!!")
482                ci[index] = 0.0
483            await net.sleep(sleep_amount)
484            """Give a push to the other branch when it is slower."""
485            return True
486        elif CONTROLLER_TYPE == "C3":
487            """This happens when controller is chosen 'C3'"""
488            count[index] += 1
489            total_delay[index] += value[1]
490
491            # [[err-defs-start]]
492
493            err = total_delay[index] - total_delay[1 - index]
494            """Calculate the difference between branches"""
495            err += 0.0 - total_delay[index]
496            """Try to minimize the total time consumed."""
497
498            # [[err-defs-end]]
499
500            sleep_amount = 1e2 * Kp * err + ci[index]
501            ci[index] = (1.0 - Zi) * ci[index] + 1e2 * Ki * err
502            """PI controller"""
503            if abs(sleep_amount) > 1e4:
504                """This should never happen."""
505                print("!!!", sleep_amount, "!!!")
506                ci[index] = 0.0
507            await net.sleep(sleep_amount)
508            """Give a push to the other branch when it is slower."""
509            return True
510
511        return value[0]  # This is the case when controller is 'C1'.
512
Results
It is assumed that, the processing time of servers are modeled by an exponential random variable with an average processing delay of 0.01 seconds (100Hz).
Each simulation starts an ab (server benchmarking tool) process which sends 1000 POST requests with 1024 byte request body size and varying number of concurrent requests.
ab tool can save the results in CSV file with the structure below.
Percentage served,Time in ms
0,5.614
1,6.456
2,6.487
3,6.529
4,6.612
5,6.646
6,6.664
For example 5th line show that, 4% of requests replied in less than 6.65 milliseconds.
In summary, the same simulation run for three different controllers and several different number of concurrent requests and CSV files are obtained.
The figure below plots CSV files for one of the concurrency levels. The x axis shows the data in the second column of the CSV format given above. The y axis shows the first column divided by 100.
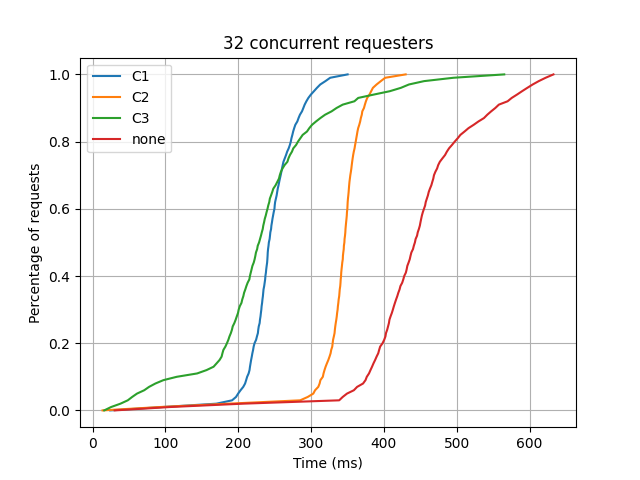
The plot resembles a cumulative normal distrbution. When the numerical derivate of y axis data is taken with respect to x axis data, the plots below is obtained for different number of concurrent requests.
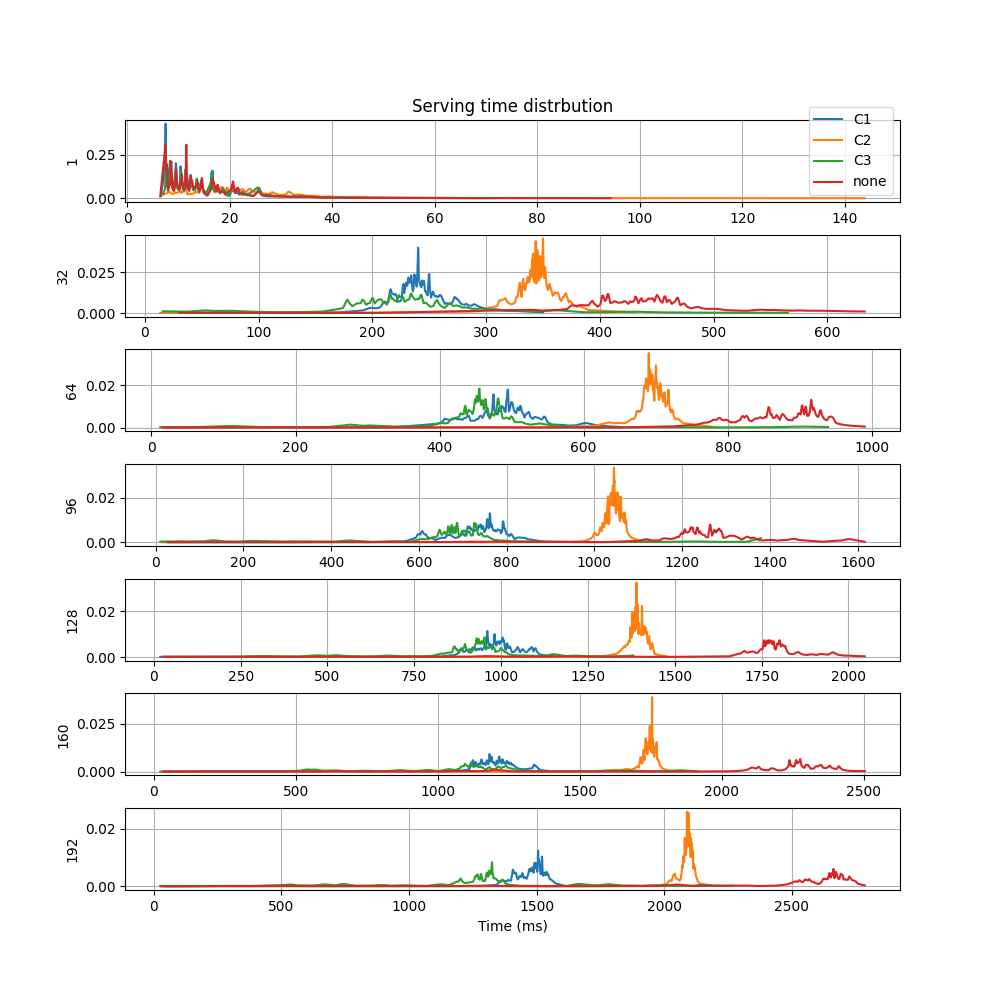
The x axis is time and the y axis is time distrbution for different number of concurrent requests. The integer values on the left of plots show the number of concurrent requests. As the number of concurrent requests increases, the average serving time increases.
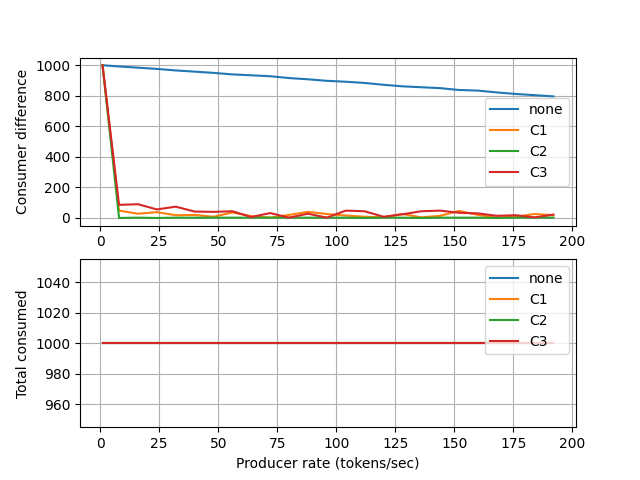
The difference between consumed requests of two HTTP servers for different control schemes. The x axis is the number of concurrent requests and the y axis shows the difference between the number of requests consumed by two HTTP servers and the total number of requests consumed.
Reproduce
sudo apt install python3-venv apache2-utils
python3 -m venv venv
source venv/bin/activate

make build
make build=http_balancer
make clean=http_balancer
make run=http_balancer
make results=http_balancer
make graph=http_balancer
make docs
Usage
Submodules
src.http_balancer.main module
- src.http_balancer.main.USAGE()
Arguments:
- -T <time (sec)>
total simulation time in seconds (\(T\))
Default: 10
- -c <none|C1|C2|C3>
controller type
Default: C1
- -o <filename>
output file name to write results. If empty, prints to stdout.
- -L <option>
- change in server load by time
e.g. 0.2,2;0.8,0.33;
Means load on 2nd consumer will be two times more than 1st consumer after time instant \(0.2T\) until time instant \(0.8T\). Then, its load will be 1/3 of 1st consumer’s load until the end of simulation.
Default: “0,1;”
- -p <rate (Hz)>
new token output rate of the producer at each second
Default: 10
- -H hostname
Default: 127.0.0.1
- -P ports
port1,port2
Default: 8888,8889
- -r <option>
- random number generator params
e.g. exponential,0.1
Meaning consumation time of a token takes a random amount of time with an exponential distrbution having an average of 0.1 seconds.
Default: exponential,0.5
- -G
if provided, the script generates PT net graph and exits
- -K
- comman separated PI controller gain values
e.g. 1e-1,1e-2
Default: 1e-2,1e-4
-A ab command’s PID
-C number of concurrent requests expected
Example
python src/http_balancer/main.py -T 8.5 -r exponential,0.05 -p 100 -c none
- src.http_balancer.main.server_main(args, cond)
src.http_balancer.results module
- src.http_balancer.results.load_results()
- src.http_balancer.results.main(argv)
- src.http_balancer.results.plot_results(results)
Comments
Plots resemble a normal distrbution with varying mean and standard deviations.
Mean value of the serving time is smallest for controller type ‘C3’ and ‘C1’.
Mean is larger but deviation from mean is smaller for ‘C2’.
Controller ‘C3’ has a smaller mean serving time than ‘C1’ for larger number of requesters. Its response can be fine tuned by adjusting the contributions of error terms below
Controller ‘C2’ performs better if closer to “deterministic” service time is required.
The number of consumed requests are equal for ‘C2’.